As a Software Engineer, one of the major difficult questions faced by the client or management is What is the cost and time for the software development? It’s difficult to weigh the real value or worth of software. One of the best ways to estimate the software development cost and time is based on previous software development experience.
To measure the standard worth of the software, as a unit of software worth, Function Point was developed. Functional Point was first defined by Allan Albrecht of IBM in 1977.
Function Point
It measures functionality from the user’s point of view.
What the user receives from Software and what the user requests from Software.
Focuses on what functionality is being delivered.
A Functional Point is a unit of measurement to express the amount of business functionality an information system provides to a user. – Source: Wikipedia
Functional Point
GA
5 Types of Functional Units
Internal Logic Files (ILF) – The control info or logically related data that is present within the system.
External Interface Files (EIF) – The control data or other logical data i.e. referenced by the system but present in another system.
External Inputs (EI) – Data/control info that comes from outside our system
External Outputs (EO) – data that goes out of the system after generation
External Enquired (EQ) – Combination of i/o – o/p resulting in data retrieval
How to Calculate Functional Points?
Final F.P = UFP X CAF UFP = Unadjusted Function Point CAF = Complexity Adjustment Factor
GA
Step 1: Each Function point is ranked according to complexity. There exist per-defined weights for each F.P in each category.
Step 2: Calculate the Unadjusted Function Point by multiplying each F.P. by its corresponding weight factor.
UFP = Sum of all the Complexities of all the EI’s, EO’s EQ’s, ILF’s and EIF’s
Step 3: Calculate Final Function Points
Final F.P = UFP X CAF
“Total Degree of Influence of the 14 General System Characteristics”
Complexity Adjustment Factor is calculated using 14 aspects of processing complexity. 14 questions answered on a scale of 0 – 5
0 – No Influences
1 – Incidental
2 – Moderate
3 – Average
4 – Significant
5 – Essential
Functional Unit
Wighting Factors
Low
Average
High
External Inputs (EI)
3
4
6
External Outputs (EO)
4
5
7
External Enquired (EQ)
3
4
6
Internal Logic Files (ILF)
7
10
15
External Interface Files (EIF)
5
7
10
14 aspects of processing complexity questions are as follows:
Data Communication
Distributed Data Processing
Performance
Heavily Used Configuration
Transaction Role
Online Data Entry
End-User Efficiency
Online Update
Complex Processing
Reusability
Installation Ease
Operational Ease
Multiple Sites
Facilitate Change
https://master2teach.com/wp-content/uploads/2024/08/master2teach_logo.svg00Adminhttps://master2teach.com/wp-content/uploads/2024/08/master2teach_logo.svgAdmin2024-08-08 08:07:372024-08-08 08:07:37Function Point
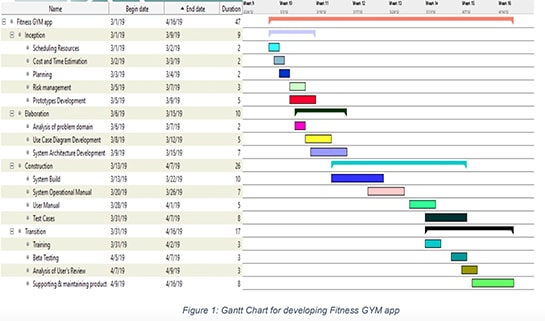
After the methodology has been selected, planning should be done very carefully. Planning software development as per the chosen methodology can be reflected in the graphical form which is known as the Gantt Chart. Gantt Chart is nothing more than a pictorial representation of planning where it shows tasks to do against time table. It is a very important tool for the project manager or software engineer to assign the job to the employee, trace the target and deadline, track the project progress, and decide to take action in case there is a risk of the project being behind or failing.
In the Gantt Chart, the list of tasks to do is listed horizontally whereas a suitable time frame is scaled vertically. Each activity is represented by a bar; the position and length of the bar reflect the start date, duration, and end date of the activity.
Gantt Chart
Gantt chart can simply be defined as a horizontal bar chart, which contains a set of tasks with a proper schedule. It was first developed by Henry L. Gantt in 1917 as a production control tool. It helps to manage which activity should we do at the beginning and when to end it, how many activities overlap, what activity should be done at last, and when the project should end.
Gantt chart will reflect on the methodology that you choose for the software development. For example, if you are developing the software using Water Fall Methodology, as we know the phases of the waterfall methodology are
Requirement Analysis
System Design
Implementation
System Testing
System Deployment
System Maintenance
In waterfall, these phases are executed one after another so we plan phase-wise. So the Gantt chart will look like the ladder.
Gantt Chart most reflects the RUP Methodology if you are going to develop the software using RUP.
In RUP, it’s not going to execute phase-wise. There will be more overlap in the planning because more than one task will be in operation simultaneously. In a team, some will be working on designing where developers are also developing the system. Of course, we know that we can’t go development without system design but in this methodology, we will not wait for the whole system design and finalize, as one module system design is finalized, the developer starts working where are designer starts to design for the next module. So that there will be more overlap in the execution. In the waterfall, we start development only after finalizing the whole system design.
Working as a software engineer is one of the most challenging jobs in the world. A software engineer has to work very hard and carefully to manage the project, resources, and clients correctly so that he/she can track the project, execute as per plan, and lead to success. Software engineers always focus on how to reduce the risk of project failure.
Software Engineering is an organized approach to the design, development, operation, and maintenance of the software system. The objectives of Software Engineering are Maintainability, Correctness, Reusability, Testability, Reliability, Portability, and Adaptability.
As a software engineer, establishing a good and efficient system needs more practice and more effort into it. Always keep in mind that until and unless, there is no proper process in the system, there is always a risk of project failure, and there will always temporary solutions. So the first job of the software engineer is to make a good system. To make a good and efficient system, software development methodology should be chosen based on the client’s requirement and the Client’s nature. There are different kinds of software development methodologies.
Among this list of methodologies, RUP is one of the most popular and effective methodologies for software development.
What is RUP?
Rational Unified Process (RUP) is a software development process from the Rational division of IBM. It can be defined as
A processed product – the development team for RUP is working closely with customers, partners, groups organizations to ensure that the process is constantly updated
The RUP leverages team productivity – it allows the team to have free access to a knowledge base with all the guidelines and tool mentors that help them overcome critical issues. This helps the entire team share the same language when developing software
The RUP creates and maintains models – instead of producing a large amount of paperwork, this method creates models – semantically rich representations of the software system your team is developing
The RUP is a guide on how to use Unified Modelling Language (UML) – UML allows your team to communicate their requirements, architecture, and design of the project.
The RUP is a configurable process – it is a simple and clear process that can fit both small development teams as well as large organizations.
Rational Unified Process (RUP) divides the development process into four distinct phases that each involve business modeling, analysis and design, implementation, testing, and deployment. The four phases are as follows:
RUP Phases
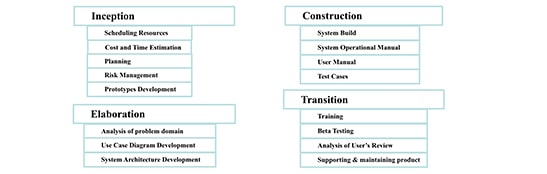
1. Inception: It is the initial phase of the developing process. Essentially, in this phase, your team determines the structure and the basic idea of the project. Also, the team will decide the purpose of the project, success criteria, estimated cost, risk assessment, scheduled time, and resources required to complete it, etc. It is just like an evaluation of the project.
The conclusions of the inception phase are:
It provides a general vision project initiative document with multiple parameters.
We get the project scope with the initial project model.
An initial business suite with financial analysis.
A project plan with different phases with a business model.
Requirement understanding.
Actual expenditures versus planned expenditures.
The major tasks involved in the Inception are as follows:
Scheduling Resources
Cost and Time Estimation
Planning
Risk Management
Prototypes Development
2. Elaboration: This is the second phase of the development process. The project’s architecture and required resources are further evaluated. This phase aims to analyze the requirements and the architecture of the system, develop the project plan, and eliminate the highest risk elements of the project. It’s undoubtedly the most critical of all stages as it signifies the transition from low-risk to high-risk. It’s also the point when your team has to decide whether to start construction (development and coding) or not.
The conclusions of the Elaboration phase are:
It provides a full model of the project with functional and non-functional requirements.
It provides a full Software Architecture Description.
It provides the stability of the project, like the vision of the product & architecture of the product stable or not?
Similarly, the project plan be approved or not?
Is the actual resource cost versus planned resource cost acceptable or not?
The major tasks involved in the Elaboration are as follows:
Analysis of the problem domain
Use Case Diagram Development
System Architecture Development
3. Construction: This is the third phase of the development process. At this stage, your team is finally ready to develop all components and features and integrate them into the product. It’s a manufacturing process where your team focuses on managing resources to optimize costs, schedules, and quality. The software is designed, written, and tested successfully.
The conclusions of the Construction phase are:
The software product is integrated into different modules.
It provides a user manual.
Is the product release stable or not?
Does it meet client requirements or not?
Is the actual resource cost versus planned resource cost acceptable or not?
The major tasks involved in the Construction are as follows:
System Build
System Operational Manual
User Manual
Test Cases
4. Transition: This is the last phase of the development process. The transition phase is the moment when the product is finally finished, released, and delivered to customers. However, once the product is given to the user, several issues can arise. This requires the team to handle all the bug fixes and correct problems or to finish some features that were postponed. It is the process of deployment.
The conclusions of the Transition phase are:
It is one type of beta testing to validate the product as per user expectations.
It allows the end-user to be satisfied or not.
All types of training manuals for the user.
The major tasks involved in the Transition Phase are as follow:
Training
Beta Testing
Analysis of User Review
Supporting & maintaining product
The benefits of RUP:
It allows you to deal with changing requirements regardless of whether they are coming from the customer or from the project itself
It emphasizes the need for accurate documentation.
It forces integration to happen throughout the software development, more specifically in the construction phase.
It allows us to deal with changing requirements within the development life cycle of the project as per the client or customer needs i.e. it welcomes change.
It supports incremental build of the software product.
It provides proper documentation of the software product.
It helps to use the resources efficiently.
It helps to identify issues early in the process life cycle.
It improves process control and risk management.
It enhances team productivity. It allows you to deal with changing requirements regardless of whether they are coming from the customer or from the project itself.
It emphasizes the need for accurate documentation.
It forces integration to happen throughout the software development, more specifically in the construction phase.
It helps reduce unexpected development costs.
The disadvantages of RUP:
It mostly relies on the ability of experts and professionals to assign the activities to individuals who should then produce pre-planned results in the form of artifacts.
The integration in the development process can also have an adverse impact on some more fundamental activities during the stages of testing
Although RUP has delivered excellent results, especially in software development, it is a rather complex method which makes its implementation challenging, particularly for smaller businesses, teams, or projects.
It is a complex model to implement as it has multiple stages of the workflow.
It is challenging for organizations to implement which has, a small team size or projects.
It should be highly result-oriented for individuals or teams.
It emphasizes the integration of modules throughout the development process of software, so this creates trouble during the testing phase.
https://master2teach.com/wp-content/uploads/2024/08/master2teach_logo.svg00Adminhttps://master2teach.com/wp-content/uploads/2024/08/master2teach_logo.svgAdmin2024-08-08 07:43:222025-02-20 04:27:38Rational Unified Process (RUP)
Agile is not a specific way of developing software.
Agile is not a framework or process.
Agile Software Development
The Manifesto for Agile Software Development
Individuals and interactions over processes and tools
Working software over comprehensive documentation
Customer collaboration over contract negotiation
Responding to change over following a plan
List of 12 Agility Principles
Our highest priority is to satisfy the customer through early and continuous delivery of valuable software.
Welcome changing requirements, even late in development. Agile processes harness change for the customer’s competitive advantage.
Deliver working software frequently, from a couple of weeks to a couple of months, with a preference for a shorter timescale.
Business people and developers must work together daily throughout the project.
Build projects around motivated individuals. Give them the environment and support they need, and trust them to get the job done.
The most efficient and effective method of conveying information to and within a development team is face-to-face conversation.
Working software is the primary measure of progress.
Agile processes promote sustainable development. The sponsors, developers, and users should be able to maintain a constant pace indefinitely.
Continuous attention to technical excellence and good design enhances agility.
Simplicity the art of maximizing the amount of work not done is essential.
The best architectures, requirements, and designs emerge from self-organizing teams.
At regular intervals, the team reflects on how to become more effective, then tunes and adjusts its behavior accordingly.
https://master2teach.com/wp-content/uploads/2024/08/master2teach_logo.svg00Adminhttps://master2teach.com/wp-content/uploads/2024/08/master2teach_logo.svgAdmin2024-08-08 06:55:232025-02-20 04:25:37Agile Software Development
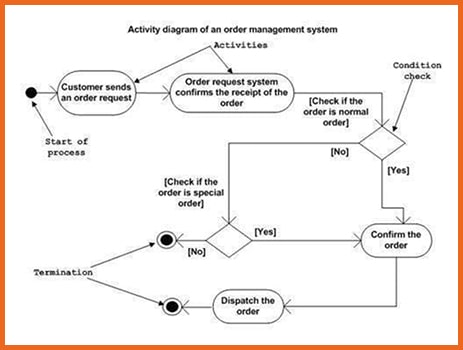
The Activity Diagram is another important diagram in UML to describe the dynamic aspects of the system. The Activity Diagram is a flowchart to represent the flow from one activity to another activity. The activity can be described as an operation of the system. The control flow is drawn from one operation to another. This flow can be sequential, branched, or concurrent. Activity diagrams deal with all types of flow control by using different elements such as fork, join, etc.
Activity Diagram
Purpose of Activity Diagrams
The basic purposes of activity diagrams are similar to the other four diagrams. It captures the dynamic behavior of the system. The other four diagrams are used to show the message flow from one object to another but the activity diagram is used to show the message flow from one activity to another.
Activity is a particular operation of the system. Activity diagrams are not only used for visualizing the dynamic nature of a system, but they are also used to construct the executable system by using forward and reverse engineering techniques. The only missing thing in the activity diagram is the message part.
It does not show any message flow from one activity to another. The Activity Diagram is sometimes considered as the flowchart. Although the diagrams look like a flowchart, they are not. It shows different flows such as parallel, branched, concurrent, and single. The purpose of an activity diagram can be described as Draw the activity flow of a system. Describe the sequence from one activity to another. Describe the parallel, branched, and concurrent flow of the system.
How to Draw an Activity Diagram?
Activity diagrams are mainly used as a flowchart that consists of activities performed by the system. Activity diagrams are not exactly flowcharts as they have some additional capabilities. These additional capabilities include branching, parallel flow, swim lane, etc.
Before drawing an activity diagram, we must have a clear understanding of the elements used in the activity diagram. The main element of an activity diagram is the activity itself. An activity is a function performed by the system. After identifying the activities, we need to understand how they are associated with constraints and conditions. Before drawing an activity diagram, we should identify the following elements Activities Association Conditions Constraints
Once the above-mentioned parameters are identified, we need to make a mental layout of the entire flow. This mental layout is then transformed into an activity diagram.
Following is an example of an activity diagram for the order management system. In the diagram, four activities are identified which are associated with conditions. One important point should be clearly understood an activity diagram cannot be exactly matched with the code. The activity diagram is made to understand the flow of activities and is mainly used by business users The following diagram is drawn with the four main activities Send order by the customer Receipt of the order Confirm the order Dispatch the order After receiving the order request, condition checks are performed to check if it is a normal or special order. After the type of order is identified, dispatch activity is performed and that is marked as the termination of the process.
Where to Use Activity Diagrams?
The basic usage of the activity diagram is similar to the other four UML diagrams. The specific usage is to model the control flow from one activity to another. This control flow does not include messages.
The Activity Diagram is suitable for modeling the activity flow of the system. An application can have multiple systems. The Activity Diagram also captures these systems and describes the flow from one system to another. This specific usage is not available in other diagrams. These systems can be databases, external queues, or any other system.
We will now look into the practical applications of the activity diagram. From the above discussion, it is clear that an activity diagram is drawn from a very high level. So it gives a high-level view of a system. This high-level view is mainly for business users or any other person who is not a technical person.
This diagram is used to model the activities which are nothing but business requirements. The diagram has more impact on business understanding rather than on implementation details. Activity diagram can be used for Modeling workflow by using activities. Modeling business requirements. High-level understanding of the system’s functionalities. Investigating business requirements at a later stage.
First of all, I would like to make clear that it is also known as a Collaboration Diagram. So these two diagram communication and collaboration diagrams are the same. Communication Diagram is used to show how objects interact to perform the behavior of a particular use case or a part of a use case.
After the expanded use case description of the major use cases, we start the communication diagram. So that you should know what is and how to write an expanded use case description. An expanded use case description is a two-way interaction step written between the actor and the system about how that particular use case will execute. It’s like the script of the movie which is written, with step-by-step execution.
Communication Diagarm
As we are drawing the design in an object-oriented way, a collaboration diagram describes a pattern of interaction among objects. It shows the objects participating in the interaction by their links to each other and the messages that they send to each other.
Collaboration diagrams are used by designers to define and clarify the roles of the objects that perform a particular flow of events of use cases. They are the primary source of information used for determining class responsibilities and interfaces.
After the collaboration diagram, we will also get the numbers of classes and their names which need to be defined in the application and its respective objects as well. Not only that but also we will know how these objects of different classes will interact and flow messages with each other stepwise. All showing this kind of information in the diagram is the Collaboration diagram. Its main purpose is to visualize the interactive behavior of the system.
We all know that objects of the classes communicate by sending and receiving messages.
Check if there are any non-functional requirements in Use Cases.
Check the use case names properly whether it’s an active verb and a noun phrase or not.
Check whether all the use cases are inside the system box or not.
Check whether the use cases are in logical order or not.
Check if there is any overlap and can be fixed by repositioning the use cases or actors.
Check whether the use case diagram contains at least one included relationship or not.
Check whether there is a line between the actors and the Included Use Cases.
Check Whether the include relationship arrow is pointed to Included Use Case or not and if the arrow is labeled with include or not.
Check whether the use case diagram contains at least one extended relationship or not.
Check whether there is a line between the actors and the Extended Use Cases.
Check whether extend relationship arrow is pointed to Base Use Case or not and is arrow labeled with extend or not.
Check whether more than one base use case extends or includes the same extended or included use case carefully.
Check whether the use case diagram contains any generalizations or not.
Check whether the arrow is a solid line with an arrow pointing towards parents actor or parents use case or not. Also, confirm that it doesn’t exist label in the arrow.
If possible, show at least one extension point in the use case diagram.
Make sure to represent all actors with a human stick image even for the machine, and external devices, and also contains at least more than one actor in the use case diagram.
Check whether primary actors are shown on the left side or not. Similarly, secondary actors are on the right side or not.
Check if is there any automatic job doing use cases in the system.
Make sure there is only one rectangle box representing a system where all the use cases are included inside the box and actors are outside of the box.
Check whether you have written the system name inside the box at the top or not.
https://master2teach.com/wp-content/uploads/2024/08/master2teach_logo.svg00Adminhttps://master2teach.com/wp-content/uploads/2024/08/master2teach_logo.svgAdmin2024-08-08 03:24:352025-02-20 04:17:52Use Case Diagram – Checklist
In this USE CASE DIAGRAM step-by-step tutorial, you will learn how to make USE CASE Diagrams from beginning to end including High-Level Use Case Descriptions, Extended Use Case Descriptions, Alternatives as well as ACTIVITY diagrams.
To explain all systems to someone else is quite difficult. The explainer may be forgetting some main features of the system while the listener may have lost what he/she is talking about. The explainer thinks that he has explained very well, but the listener may not understand it. For example, you want to make a new app and explain it. However, the listener doesn’t know how they will interact with the app or what it will do.
Use Case Diagram
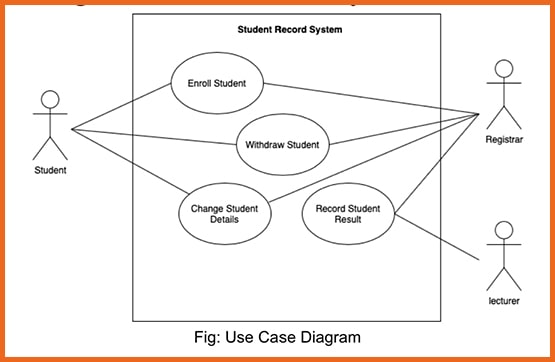
In this type of scenario, the Use Case Diagram is very helpful. Simply it shows a system or application, people or organizations, or others that interact with the system, the basic flow of the system what the system or application does. It’s a very high-level diagram and typically won’t show a lot of detail, but it’s a great way to communicate complex ideas in a fairly basic way.
Use case show the functionality of a system from the user’s perspective. Each Use case name is usually an active verb and a noun phrase. A use case diagram is usually used to model a current system and a proposed system.
Use Case Diagram
How to start drawing a Use Case Diagram?
List use cases and identify the actors.
Prioritize use cases and focus from the top of the list.
Develop each of the priority use cases starting with writing a description for each.
4 elements of the USE CASE
System
Actors
Use Cases
Relationships
2. Actor: The Actor is represented by the human stick image. Anyone who used to perform a certain function in the system is an actor. Actors may be someone or something that can be a person, an organization, another system, a machine, or an external device. So who or what is going to using our system is Actors like customers, staff, admin, bank, students, teachers, etc.
Type of Actors:
Primary Actors
Secondary Actors
A primary actor initiates the use of the system while the secondary actor is more reactionary. For example, customers are the primary actors because the system is mostly used by the customer whereas the Bank is a secondary actor because the bank is only going to perform certain functions once the primary actor does something. In other simple words, primary actors request something from the system, and secondary actors respond to the primary actors.
Use Case Actors
Primary Actors should be positioned to the left of the system whereas Secondary Actors are placed on the right side of the system.
3. Use Case: All the functionality that the system does is the USE CASE. In other words, the list of tasks that the system can perform is a Use Case. Use Case is denoted by the oval shape. For example: – login, check balance, transfer funds, make payment, display error message, verify log-in details, etc. Its good practice to put the Use Cases in a logical order where possible like login (1st job), book service (After Login Job), make payment (After Book Job)
4. Relationship: As we know, an actor uses the system to achieve a goal by interacting with at least one of the Use Cases within the system. For example, Customers can log in, book the service, make payments, etc. So we draw a solid line between the Actor and the Use Case to show the relationship. This type of relationship is called an association and it just signifies a basic communication or interaction.
Type of Relationship in addition to association:
Include
Extend
Generalization
Whenever a customer requests the login, the system will automatically call the login verification Use Case before completing the login process. However, if the login detail is incorrect, the system will display an error message. So Error Message is another extra Use Case to show the relationship. Neither of the actors is directly initiating these (Verify Login, Display Error Message, etc.) Use Cases. They are just immediately going to happen within the system whenever the actor performs the Log in Use Case. The relationship between the Login Use Case and the Verify Login Details Use Case is INCLUDE which is written as <<include>> because as the Login Use Case is called by the actor, Verify Login Details Use Case is automatically performed by the system. Here Login Use Case is the Base Use Case whereas Verify Login Details is an Included Use Case. In the include relationship, whenever the base use case is in execution, the included use case is auto-executed as well. In another way, the base use case requires an included use case in order to be complete. For showing Include Relationship, draw a dashed line with an arrow that points towards the included use case and write <<include>> as a label.
Another type of relationship is Extend Relationship which defines the relationship between the Base Use Case and the Extend Use Case. In the Extend relationship, the extended use case may or may not execute when the base use case is executing. The extended use case will only happen if certain criteria are met. In the above example, the Login is a base use case whereas the Display Error Message is an Extend Use Case. The Display Error Message Use Case may or may not execute when the Base Use Case is executed. For the Extend the Relation between the base and extend use case, draw a dashed line with an arrow that points towards the base use case and write as << Extend >> label between them.
Another the best example to demonstrate the difference between include and extend relationships is: if you sneeze, you will close your eyes. That’s an included relationship because it’s going to happen whenever we sneeze. Whereas, if you sneeze, you might say excuse me. That’s an extended relationship because it supplements the sneeze, but isn’t completely necessary in the sneezing process.
Note: Include happens every time, extend happens just sometimes, and don’t forget that the arrows point in opposite directions. Also, multiple base use cases can point to the same included or extended use case. Avoid premature use, overuse, and misuse of the <<include>> and <<extend>> relationships.
Include Extend Use Case
The Simpler your diagram, the Better. When producing a Use Case Model always keep in mind what you are trying to portray and for what purpose.
Another type of relationship is Generalization, also known as inheritance. Generalization is showing the relationship between the parent and the child use case relationship. In simple words, generalization is showing the type of actor or use case in the system. For the generalization relationship, draw a solid line with an arrow from the child use case or actor to the parent use case or actor as shown below.
For example, the system has a New Customer as well as an Old Customer which can be shown in generalization.
Use Case Generalization
Another type of Notation is Extension Points. Extension points are just detailed versions of extended relationships. It also can be shown in the note what sort of conditions would lead to these extension points.
User Case Extension
In this way you can draw the complete Use Case Diagram with various elements that help explain what the system does. Note: Even complex systems should be restricted to a simplistic visualization of functionality, behavior, and relationships.
Types of Use Case Descriptions
High Level A general description
Expanded (Detailed) Step by step
Essential – free of technological detail
Real adds technological detail
High-Level Use Case Description
A short non-detailed description of each required process. Do not go into details on the interaction.
Example: High-Level Use Case Description
Use Case:
Enroll Student
Actor:
New Student
Description:
A new student provides personal details and his/her choice of course to the system. He/She pays fees and receives confirmation of enrollment.
High-Level Use Case Description
https://master2teach.com/wp-content/uploads/2024/08/master2teach_logo.svg00Adminhttps://master2teach.com/wp-content/uploads/2024/08/master2teach_logo.svgAdmin2024-08-07 11:24:002025-01-01 01:46:11Use Case Diagram