Gantt Chart
After the methodology has been selected, planning should be done very carefully. Planning software development as per the chosen methodology can be reflected in the graphical form which is known as the Gantt Chart. Gantt Chart is nothing more than a pictorial representation of planning where it shows tasks to do against time table. It is a very important tool for the project manager or software engineer to assign the job to the employee, trace the target and deadline, track the project progress, and decide to take action in case there is a risk of the project being behind or failing.
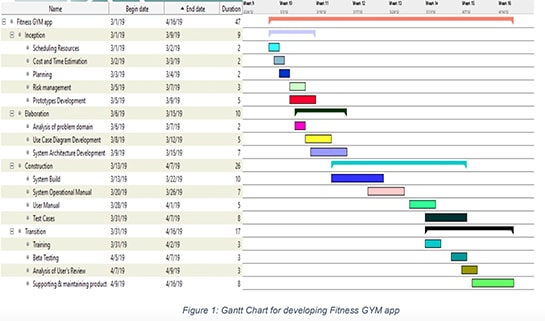
In the Gantt Chart, the list of tasks to do is listed horizontally whereas a suitable time frame is scaled vertically. Each activity is represented by a bar; the position and length of the bar reflect the start date, duration, and end date of the activity.
Gantt chart can simply be defined as a horizontal bar chart, which contains a set of tasks with a proper schedule. It was first developed by Henry L. Gantt in 1917 as a production control tool. It helps to manage which activity should we do at the beginning and when to end it, how many activities overlap, what activity should be done at last, and when the project should end.
Gantt chart will reflect on the methodology that you choose for the software development. For example, if you are developing the software using Water Fall Methodology, as we know the phases of the waterfall methodology are
- Requirement Analysis
- System Design
- Implementation
- System Testing
- System Deployment
- System Maintenance
In waterfall, these phases are executed one after another so we plan phase-wise. So the Gantt chart will look like the ladder.
Gantt Chart most reflects the RUP Methodology if you are going to develop the software using RUP.
In RUP, it’s not going to execute phase-wise. There will be more overlap in the planning because more than one task will be in operation simultaneously. In a team, some will be working on designing where developers are also developing the system. Of course, we know that we can’t go development without system design but in this methodology, we will not wait for the whole system design and finalize, as one module system design is finalized, the developer starts working where are designer starts to design for the next module. So that there will be more overlap in the execution. In the waterfall, we start development only after finalizing the whole system design.
Leave a Reply
Want to join the discussion?Feel free to contribute!